


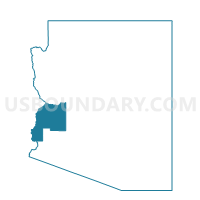
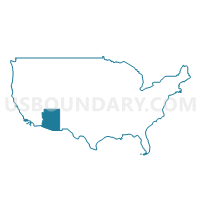
Parker CCD, La Paz County, Arizona
About
Outline

Summary
| Unique Area Identifier | 122789 |
| Name | Parker CCD |
| County | La Paz County |
| State | Arizona |
| Area (square miles) | 4,513.75 |
| Land Area (square miles) | 4,499.63 |
| Water Area (square miles) | 14.12 |
| % of Land Area | 99.69 |
| % of Water Area | 0.31 |
| Latitude of the Internal Point | 33.72762490 |
| Longtitude of the Internal Point | -114.03879330 |
| Total Population | 20,489 |
| Total Housing Units | 16,049 |
| Total Households | 9,198 |
| Median Age | 53.9 |
Maps

Graphs
Select a template below for downloading or customizing gragh for Parker CCD, La Paz County, Arizona


Neighbors
Neighoring County Subdivision (by Name) Neighboring County Subdivision on the Map
- Blythe CCD, Riverside County, CA
- Buckeye CCD, Maricopa County, AZ
- Chuckwalla Valley CCD, Riverside County, CA
- Congress CCD, Yavapai County, AZ
- East Imperial CCD, Imperial County, CA
- Lake Havasu City CCD, Mohave County, AZ
- Needles CCD, San Bernardino County, CA
- Wellton CCD, Yuma County, AZ
- Wickenburg CCD, Maricopa County, AZ
- Yuma CCD, Yuma County, AZ
Top 10 Neighboring Place (by Population) Neighboring Place on the Map
- Blythe city, CA (20,817)
- Quartzsite town, AZ (3,677)
- Parker town, AZ (3,083)
- Cienega Springs CDP, AZ (1,798)
- Salome CDP, AZ (1,530)
- Ehrenberg CDP, AZ (1,470)
- Big River CDP, CA (1,327)
- Bouse CDP, AZ (996)
- Wenden CDP, AZ (728)
- Bluewater CDP, AZ (725)
Top 10 Neighboring Elementary School District (by Population) Neighboring Elementary School District on the Map
- Yuma Elementary District, AZ (99,267)
- Quartzsite Elementary District, AZ (6,162)
- Wellton Elementary District, AZ (4,038)
- Salome Consolidated Elementary District, AZ (2,763)
- Congress Elementary District, AZ (2,439)
- Mohawk Valley Elementary District, AZ (1,597)
- Arlington Elementary District, AZ (1,472)
- Bouse Elementary District, AZ (1,181)
- Aguila Elementary District, AZ (1,179)
- Wenden Elementary District, AZ (815)
Top 10 Neighboring Secondary School District (by Population) Neighboring Secondary School District on the Map
- Yuma Union High School District, AZ (189,381)
- Buckeye Union High School District, AZ (65,817)
- Bicentennial Union High School District, AZ (10,921)
- Antelope Union High School District, AZ (6,370)
Top 10 Neighboring Unified School District (by Population) Neighboring Unified School District on the Map
- Palo Verde Unified School District, CA (24,294)
- Parker Unified School District, AZ (9,568)
- Saddle Mountain Unified School District, AZ (8,821)
- Needles Unified School District, CA (7,087)
- San Pasqual Valley Unified School District, CA (3,464)
Top 10 Neighboring State Legislative District Lower Chamber (by Population) Neighboring State Legislative District Lower Chamber on the Map
- Assembly District 80, CA (546,875)
- Assembly District 34, CA (487,193)
- State House District 4, AZ (294,239)
- State House District 3, AZ (216,687)
- State House District 25, AZ (208,220)
- State House District 24, AZ (207,694)
Top 10 Neighboring State Legislative District Upper Chamber (by Population) Neighboring State Legislative District Upper Chamber on the Map
- State Senate District 37, CA (1,215,876)
- State Senate District 18, CA (1,048,811)
- State Senate District 40, CA (1,018,606)
- State Senate District 4, AZ (294,239)
- State Senate District 3, AZ (216,687)
- State Senate District 25, AZ (208,220)
- State Senate District 24, AZ (207,694)
Top 10 Neighboring 111th Congressional District (by Population) Neighboring 111th Congressional District on the Map
- Congressional District 2, AZ (972,839)
- Congressional District 45, CA (914,209)
- Congressional District 7, AZ (855,769)
- Congressional District 41, CA (797,133)
- Congressional District 1, AZ (774,310)
- Congressional District 51, CA (757,891)
Top 10 Neighboring Census Tract (by Population) Neighboring Census Tract on the Map
- Census Tract 9548, Mohave County, AZ (7,012)
- Census Tract 9534.02, Mohave County, AZ (5,621)
- Census Tract 405.15, Maricopa County, AZ (4,792)
- Census Tract 506.03, Maricopa County, AZ (4,536)
- Census Tract 205.02, La Paz County, AZ (4,388)
- Census Tract 9403, La Paz County, AZ (3,997)
- Census Tract 14.03, Yavapai County, AZ (3,630)
- Census Tract 9402, La Paz County, AZ (3,080)
- Census Tract 201, La Paz County, AZ (2,815)
- Census Tract 469, Riverside County, CA (2,043)
Top 10 Neighboring 5-Digit ZIP Code Tabulation Area (by Population) Neighboring 5-Digit ZIP Code Tabulation Area on the Map
- 85365, AZ (46,558)
- 92225, CA (24,310)
- 86406, AZ (23,763)
- 85344, AZ (9,147)
- 85354, AZ (6,645)
- 85346, AZ (4,423)
- 92283, CA (3,158)
- 85348, AZ (2,786)
- 92242, CA (1,539)
- 85334, AZ (1,482)
Data
Demographic, Population, Households, and Housing Units
** Data sources from census 2010 **
Show Data on Map
Download Full List as CSV
Download Quick Sheet as CSV
| Subject | This Area | La Paz County | Arizona | National |
|---|---|---|---|---|
| POPULATION | ||||
| Total Population Map | 20,489 | 20,489 | 6,392,017 | 308,745,538 |
| POPULATION, HISPANIC OR LATINO ORIGIN | ||||
| Not Hispanic or Latino Map | 15,683 | 15,683 | 4,496,868 | 258,267,944 |
| Hispanic or Latino Map | 4,806 | 4,806 | 1,895,149 | 50,477,594 |
| POPULATION, RACE | ||||
| White alone Map | 14,306 | 14,306 | 4,667,121 | 223,553,265 |
| Black or African American alone Map | 129 | 129 | 259,008 | 38,929,319 |
| American Indian and Alaska Native alone Map | 2,628 | 2,628 | 296,529 | 2,932,248 |
| Asian alone Map | 107 | 107 | 176,695 | 14,674,252 |
| Native Hawaiian and Other Pacific Islander alone Map | 7 | 7 | 12,648 | 540,013 |
| Some Other Race alone Map | 2,551 | 2,551 | 761,716 | 19,107,368 |
| Two or More Races Map | 761 | 761 | 218,300 | 9,009,073 |
| POPULATION, SEX | ||||
| Male Map | 10,550 | 10,550 | 3,175,823 | 151,781,326 |
| Female Map | 9,939 | 9,939 | 3,216,194 | 156,964,212 |
| POPULATION, AGE (18 YEARS) | ||||
| 18 years and over Map | 16,811 | 16,811 | 4,763,003 | 234,564,071 |
| Under 18 years | 3,678 | 3,678 | 1,629,014 | 74,181,467 |
| POPULATION, AGE | ||||
| Under 5 years | 1,028 | 1,028 | 455,715 | 20,201,362 |
| 5 to 9 years | 1,005 | 1,005 | 453,680 | 20,348,657 |
| 10 to 14 years | 979 | 979 | 448,664 | 20,677,194 |
| 15 to 17 years | 666 | 666 | 270,955 | 12,954,254 |
| 18 and 19 years | 371 | 371 | 190,627 | 9,086,089 |
| 20 years | 182 | 182 | 93,756 | 4,519,129 |
| 21 years | 135 | 135 | 89,342 | 4,354,294 |
| 22 to 24 years | 468 | 468 | 259,486 | 12,712,576 |
| 25 to 29 years | 801 | 801 | 439,998 | 21,101,849 |
| 30 to 34 years | 797 | 797 | 416,695 | 19,962,099 |
| 35 to 39 years | 746 | 746 | 415,693 | 20,179,642 |
| 40 to 44 years | 922 | 922 | 406,801 | 20,890,964 |
| 45 to 49 years | 1,105 | 1,105 | 427,022 | 22,708,591 |
| 50 to 54 years | 1,317 | 1,317 | 415,524 | 22,298,125 |
| 55 to 59 years | 1,451 | 1,451 | 375,268 | 19,664,805 |
| 60 and 61 years | 680 | 680 | 144,092 | 7,113,727 |
| 62 to 64 years | 1,153 | 1,153 | 206,868 | 9,704,197 |
| 65 and 66 years | 815 | 815 | 119,102 | 5,319,902 |
| 67 to 69 years | 1,391 | 1,391 | 163,764 | 7,115,361 |
| 70 to 74 years | 1,999 | 1,999 | 215,026 | 9,278,166 |
| 75 to 79 years | 1,375 | 1,375 | 162,261 | 7,317,795 |
| 80 to 84 years | 718 | 718 | 118,278 | 5,743,327 |
| 85 years and over | 385 | 385 | 103,400 | 5,493,433 |
| MEDIAN AGE BY SEX | ||||
| Both sexes Map | 53.90 | 53.90 | 35.90 | 37.20 |
| Male Map | 54.00 | 54.00 | 34.80 | 35.80 |
| Female Map | 53.90 | 53.90 | 37.20 | 38.50 |
| HOUSEHOLDS | ||||
| Total Households Map | 9,198 | 9,198 | 2,380,990 | 116,716,292 |
| HOUSEHOLDS, HOUSEHOLD TYPE | ||||
| Family households: Map | 5,584 | 5,584 | 1,576,520 | 77,538,296 |
| Husband-wife family Map | 4,346 | 4,346 | 1,146,036 | 56,510,377 |
| Other family: Map | 1,238 | 1,238 | 430,484 | 21,027,919 |
| Male householder, no wife present Map | 372 | 372 | 134,171 | 5,777,570 |
| Female householder, no husband present Map | 866 | 866 | 296,313 | 15,250,349 |
| Nonfamily households: Map | 3,614 | 3,614 | 804,470 | 39,177,996 |
| Householder living alone Map | 2,957 | 2,957 | 621,008 | 31,204,909 |
| Householder not living alone Map | 657 | 657 | 183,462 | 7,973,087 |
| HOUSEHOLDS, HISPANIC OR LATINO ORIGIN OF HOUSEHOLDER | ||||
| Not Hispanic or Latino householder: Map | 7,881 | 7,881 | 1,880,167 | 103,254,926 |
| Hispanic or Latino householder: Map | 1,317 | 1,317 | 500,823 | 13,461,366 |
| HOUSEHOLDS, RACE OF HOUSEHOLDER | ||||
| Householder who is White alone | 7,310 | 7,310 | 1,892,326 | 89,754,352 |
| Householder who is Black or African American alone | 58 | 58 | 92,994 | 14,129,983 |
| Householder who is American Indian and Alaska Native alone | 847 | 847 | 82,898 | 939,707 |
| Householder who is Asian alone | 38 | 38 | 57,594 | 4,632,164 |
| Householder who is Native Hawaiian and Other Pacific Islander alone | 1 | 1 | 3,443 | 143,932 |
| Householder who is Some Other Race alone | 737 | 737 | 200,098 | 4,916,427 |
| Householder who is Two or More Races | 207 | 207 | 51,637 | 2,199,727 |
| HOUSEHOLDS, HOUSEHOLD TYPE BY HOUSEHOLD SIZE | ||||
| Family households: Map | 5,584 | 5,584 | 1,576,520 | 77,538,296 |
| 2-person household Map | 3,501 | 3,501 | 665,956 | 31,882,616 |
| 3-person household Map | 828 | 828 | 322,155 | 17,765,829 |
| 4-person household Map | 576 | 576 | 288,309 | 15,214,075 |
| 5-person household Map | 393 | 393 | 162,449 | 7,411,997 |
| 6-person household Map | 144 | 144 | 76,255 | 3,026,278 |
| 7-or-more-person household Map | 142 | 142 | 61,396 | 2,237,501 |
| Nonfamily households: Map | 3,614 | 3,614 | 804,470 | 39,177,996 |
| 1-person household Map | 2,957 | 2,957 | 621,008 | 31,204,909 |
| 2-person household Map | 593 | 593 | 148,999 | 6,360,012 |
| 3-person household Map | 37 | 37 | 22,171 | 992,156 |
| 4-person household Map | 18 | 18 | 8,346 | 411,171 |
| 5-person household Map | 8 | 8 | 2,495 | 126,634 |
| 6-person household Map | 1 | 1 | 840 | 48,421 |
| 7-or-more-person household Map | 0 | 0 | 611 | 34,693 |
| HOUSING UNITS | ||||
| Total Housing Units Map | 16,049 | 16,049 | 2,844,526 | 131,704,730 |
| HOUSING UNITS, OCCUPANCY STATUS | ||||
| Occupied Map | 9,198 | 9,198 | 2,380,990 | 116,716,292 |
| Vacant Map | 6,851 | 6,851 | 463,536 | 14,988,438 |
| HOUSING UNITS, OCCUPIED, TENURE | ||||
| Owned with a mortgage or a loan Map | 2,268 | 2,268 | 1,132,662 | 52,979,430 |
| Owned free and clear Map | 4,804 | 4,804 | 439,025 | 23,006,644 |
| Renter occupied Map | 2,126 | 2,126 | 809,303 | 40,730,218 |
| HOUSING UNITS, VACANT, VACANCY STATUS | ||||
| For rent Map | 586 | 586 | 120,490 | 4,137,567 |
| Rented, not occupied Map | 41 | 41 | 5,449 | 206,825 |
| For sale only Map | 370 | 370 | 64,407 | 1,896,796 |
| Sold, not occupied Map | 48 | 48 | 10,550 | 421,032 |
| For seasonal, recreational, or occasional use Map | 5,318 | 5,318 | 184,327 | 4,649,298 |
| For migrant workers Map | 52 | 52 | 538 | 24,161 |
| Other vacant Map | 436 | 436 | 77,775 | 3,652,759 |
| HOUSING UNITS, OCCUPIED, AVERAGE HOUSEHOLD SIZE BY TENURE | ||||
| Total: Map | 2.19 | 2.19 | 2.63 | 2.58 |
| Owner occupied Map | 2.09 | 2.09 | 2.63 | 2.65 |
| Renter occupied Map | 2.51 | 2.51 | 2.62 | 2.44 |
| HOUSING UNITS, OCCUPIED, TENURE BY RACE OF HOUSEHOLDER | ||||
| Owner occupied: Map | 7,072 | 7,072 | 1,571,687 | 75,986,074 |
| Householder who is White alone Map | 5,939 | 5,939 | 1,324,907 | 63,446,275 |
| Householder who is Black or African American alone Map | 32 | 32 | 36,538 | 6,261,464 |
| Householder who is American Indian and Alaska Native alone Map | 506 | 506 | 47,653 | 509,588 |
| Householder who is Asian alone Map | 23 | 23 | 35,929 | 2,688,861 |
| Householder who is Native Hawaiian and Other Pacific Islander alone Map | 1 | 1 | 1,532 | 61,911 |
| Householder who is Some Other Race alone Map | 440 | 440 | 99,247 | 1,975,817 |
| Householder who is Two or More Races Map | 131 | 131 | 25,881 | 1,042,158 |
| Renter occupied: Map | 2,126 | 2,126 | 809,303 | 40,730,218 |
| Householder who is White alone Map | 1,371 | 1,371 | 567,419 | 26,308,077 |
| Householder who is Black or African American alone Map | 26 | 26 | 56,456 | 7,868,519 |
| Householder who is American Indian and Alaska Native alone Map | 341 | 341 | 35,245 | 430,119 |
| Householder who is Asian alone Map | 15 | 15 | 21,665 | 1,943,303 |
| Householder who is Native Hawaiian and Other Pacific Islander alone Map | 0 | 0 | 1,911 | 82,021 |
| Householder who is Some Other Race alone Map | 297 | 297 | 100,851 | 2,940,610 |
| Householder who is Two or More Races Map | 76 | 76 | 25,756 | 1,157,569 |
| HOUSING UNITS, OCCUPIED, TENURE BY HISPANIC OR LATINO ORIGIN OF HOUSEHOLDER | ||||
| Owner occupied: Map | 7,072 | 7,072 | 1,571,687 | 75,986,074 |
| Not Hispanic or Latino householder Map | 6,247 | 6,247 | 1,299,001 | 69,617,625 |
| Hispanic or Latino householder Map | 825 | 825 | 272,686 | 6,368,449 |
| Renter occupied: Map | 2,126 | 2,126 | 809,303 | 40,730,218 |
| Not Hispanic or Latino householder Map | 1,634 | 1,634 | 581,166 | 33,637,301 |
| Hispanic or Latino householder Map | 492 | 492 | 228,137 | 7,092,917 |
| HOUSING UNITS, OCCUPIED, TENURE BY HOUSEHOLD SIZE | ||||
| Owner occupied: Map | 7,072 | 7,072 | 1,571,687 | 75,986,074 |
| 1-person household Map | 2,195 | 2,195 | 353,988 | 16,453,569 |
| 2-person household Map | 3,558 | 3,558 | 608,970 | 27,618,605 |
| 3-person household Map | 562 | 562 | 221,739 | 12,517,563 |
| 4-person household Map | 355 | 355 | 197,439 | 10,998,793 |
| 5-person household Map | 218 | 218 | 104,232 | 5,057,765 |
| 6-person household Map | 94 | 94 | 47,784 | 1,965,796 |
| 7-or-more-person household Map | 90 | 90 | 37,535 | 1,373,983 |
| Renter occupied: Map | 2,126 | 2,126 | 809,303 | 40,730,218 |
| 1-person household Map | 762 | 762 | 267,020 | 14,751,340 |
| 2-person household Map | 536 | 536 | 205,985 | 10,624,023 |
| 3-person household Map | 303 | 303 | 122,587 | 6,240,422 |
| 4-person household Map | 239 | 239 | 99,216 | 4,626,453 |
| 5-person household Map | 183 | 183 | 60,712 | 2,480,866 |
| 6-person household Map | 51 | 51 | 29,311 | 1,108,903 |
| 7-or-more-person household Map | 52 | 52 | 24,472 | 898,211 |
Loading...